What’s Up With That?

Buyer Beware
This post isn’t a condemnation of the U.S. Geological Survey (USGS), but a caution that all USGS Topo maps aren’t created equal. In fact, I think the USGS is one of the very few worthwhile government services. So let’s take a look at some of the inconsistencies of these topo maps that might cause problems for those walking in wild areas.
The USGS has produced over 54,000 topographical maps to cover all of the 48 contiguous States and Hawaii. The difficulty is updating maps, so many of the maps available are rather old by modern standards… however for the backpacker, even a 40 year old map will work just fine, other than the magnetic declination printed on the map has become outdated and inaccurate.
A Case Study
In 2008 I did a 4-day backpacking trip in the Nevada desert near Lake Mead. In preparation for the trip four contiguous USGS Topographical Maps were purchased from the National Park Service. What is interesting is that each map was different. Let’s take a look at two of the maps and consider some of the obstacles they presented.
Map Information
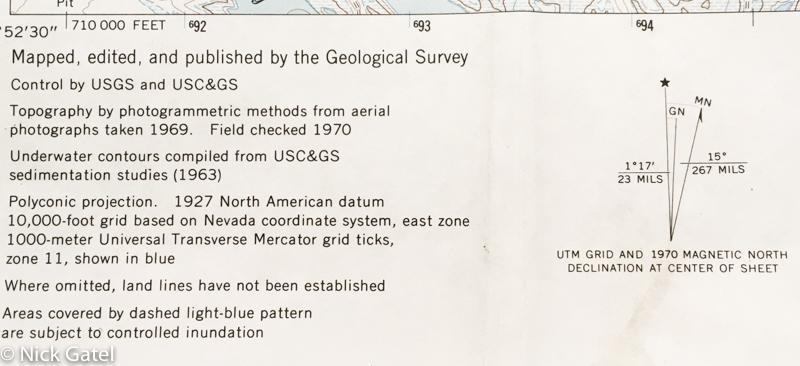
From the picture above you will see the Magnetic Declination is from 1970 and is 15˚ East. Today the declination is 11˚ 35′ or nearly 3.5˚ different from 1970! Also note the Grid North Line is 1˚17′ east of True North in 1970. This can cause some serious compass navigation problems. If the hiker used 15˚ East declination for navigating with a compass and walked 10 miles to his destination, he would be almost 3,500 feet off the target — that’s 2/3 of a mile! For techniques on how to adjust for magnetic declination see: Set Up Your Compass Faster & More Accurately With A Map Protractor.
Now let’s take a look at the second map.

Map 2 is a “Provisional Map” meaning that the final edits have not been completed. Note that there is no Magnetic Declination diagram, as there is on Map 1 that was released 13 years before Map 2. How long does it take the USGS to release an updated map? In this case, the new map was released in 2014, six years after my trip, and 31 years after the provisional map was released.
Although there is no Magnetic Declination diagram, the information is in the text. Declination is 14˚ 30′ East, as of 1983. Since the map is adjacent to Map 1, the declination are the same for each. The Grid North Declination (1983) is 1˚ 22′.
Map Gridlines
Now let’s take a closer look at Map 2 (1983).
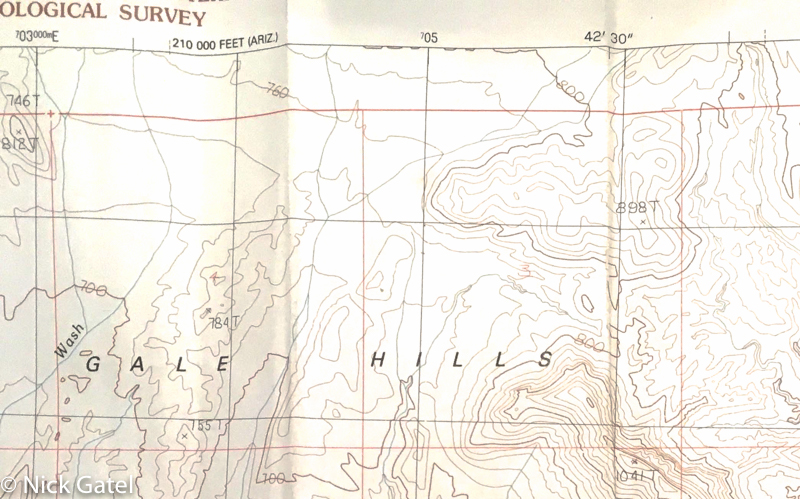
Most USGS Topo 7.5 minute maps printed in the past 30 years have UTM grids that are exactly 1 kilometer wide and tall, which exactly matches the 1:24,000 scale. Take a close look at the picture above and note the black lines running north/south and east/west. These lines create 1 kilometer grids. If you want to orient a map with a compass, align the compass edge with the north/south gridline in the center of the map.
Now notice that there are some red lines on the map running north/south and east/west. Red gridlines are land survey markings, usually (but not always) a quarter section. A section is 640 acres and is 1 mile by 1 mile, so 4 contiguous red squares are probably a section. Take a close look at the Red and Black north/south lines on the left of the map — the black line is the gridline, which is almost True North. The red line next to it is not even close to being parallel, meaning it isn’t close to running north/south. Never orient a map using the red lines as a north/south reference.
Now, let’s take a look at Map 1 (1970)
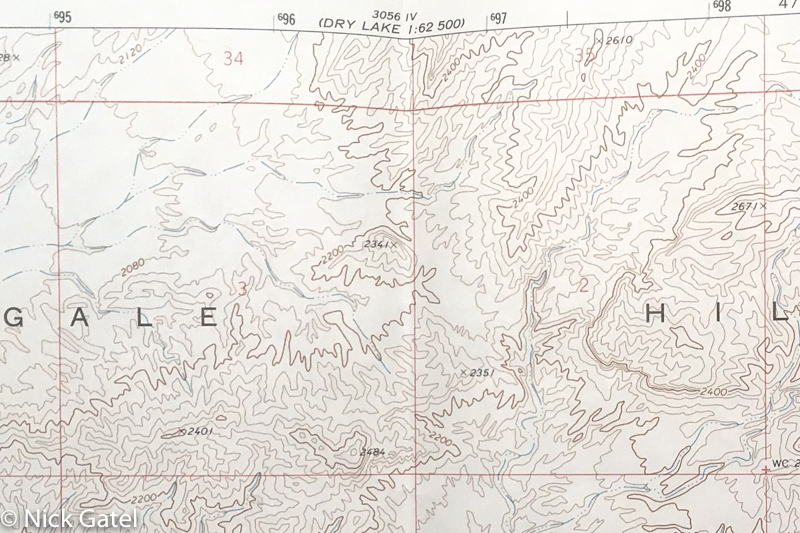
Notice that there are no black gridlines, only the land survey red gridlines. So how do you orient a map with a compass without the north/south gridlines if you follow the rule to never orient a map using the red lines as a north/south reference? Simple… take a look at the top edge of the map and you will see several tick marks with superscript “6”. 695, 696, 697, 698. There matching tick marks at the bottom of the map, and simply drawing a line through each tick mark will create a north/south gridline. There are also similar tick marks on the left and right side of the map, and drawing a line will create east/west gridlines. If you were to draw lines through every tick mark, you would end up with the 1 kilometer grids as shown in Map 2 above.
These tick marks are UTM identifiers. If you want to learn more about the UTM system, this link will probably be helpful.
Notice that I did not draw north/south gridlines on this map. This was because I did not need (or plan) on using a compass on the trip. However, I did bring a compass just in case.
Contour Lines
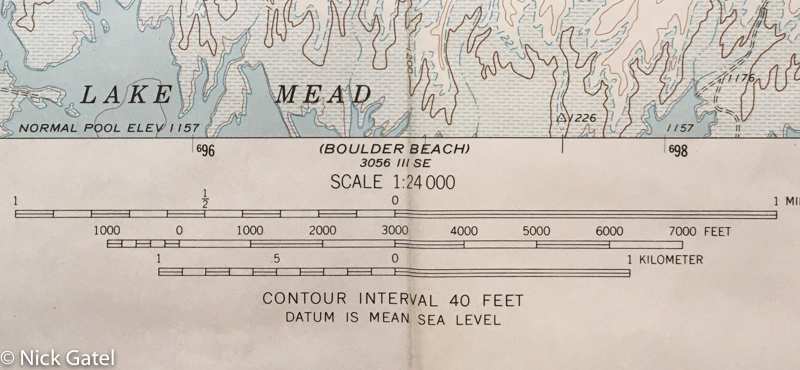
Topo maps have contour lines that indicate elevation changes in terrain. Understanding these lines and knowing how to use them is a critical skill. Up until this trip, every 7.5 minute map I had used for nearly 50 years used lines that indicated a 40 foot change in elevation. This information is also found at the bottom of every USGS Topo Map.
However on this trip, the rules had changed
Day 1 of this trip had me hiking through a slot canyon, and then continuing out of the slot along a wash. From here I would hike up out of the wash and cross a ridge, then descend into a natural bowl of red rock formations. Planning my route ahead of time, I knew crossing the ridge would be a somewhat tenuous route, but very doable using care.
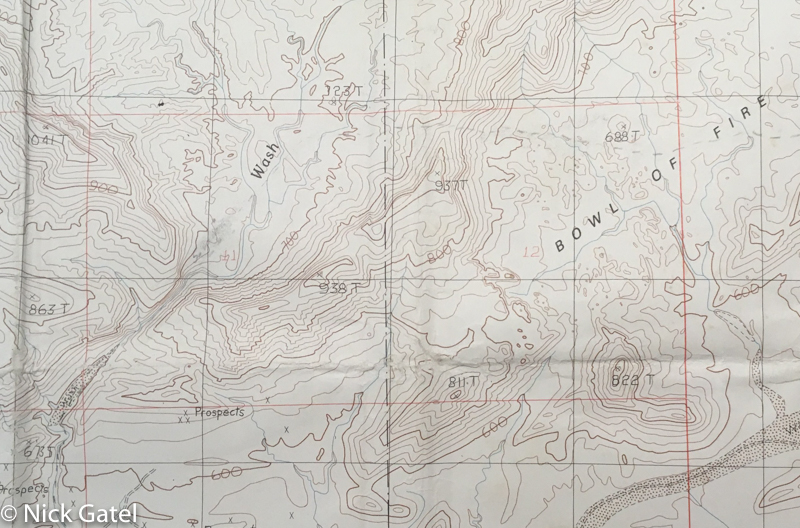
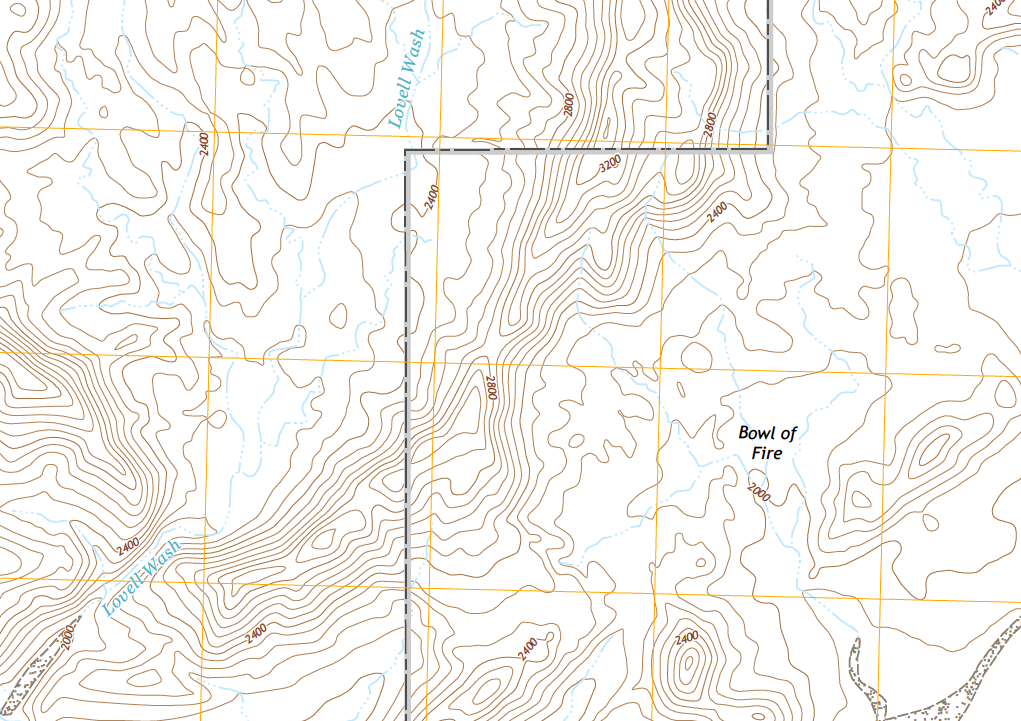
Looking at the map above, you can see “Wash” on the left of a ridge and the Bowl of Fire on the other side. My intended route was to walk over the ridge into the bowl, and spend the night sleeping among the red rock formations.
Hiking through the slot canyon
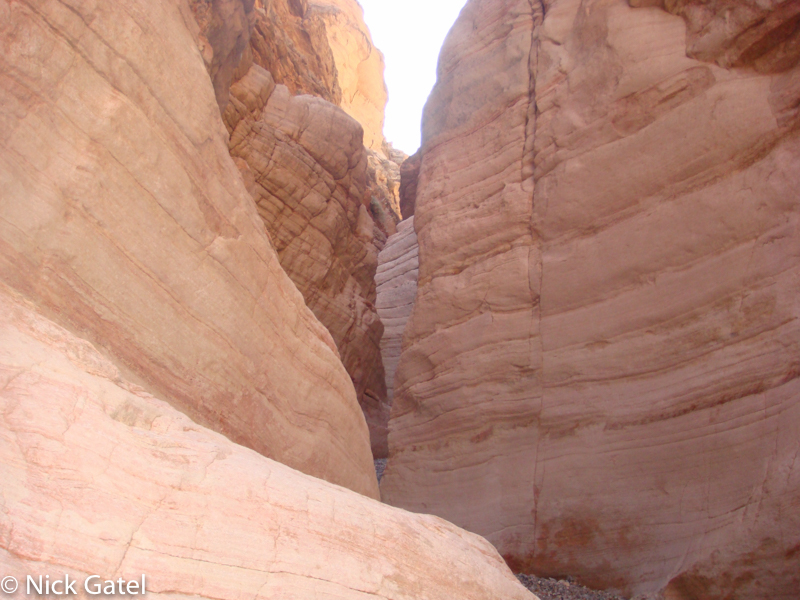
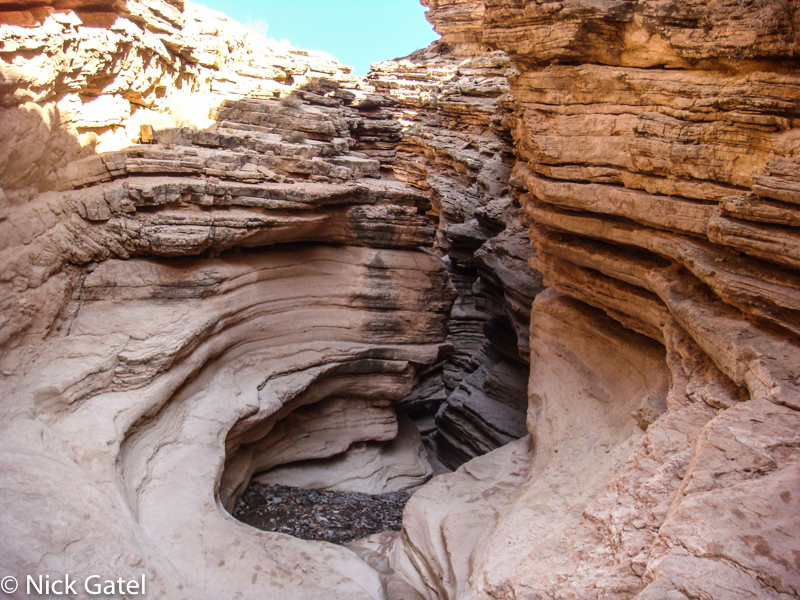
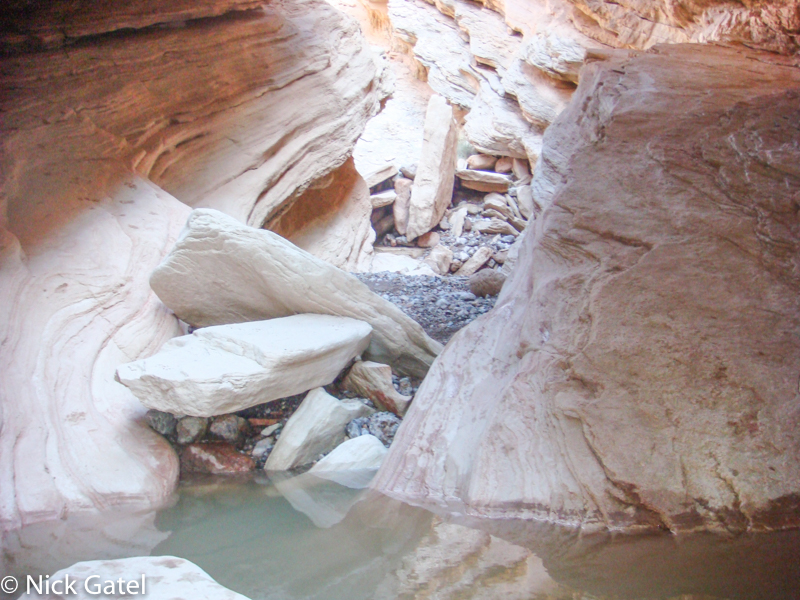
Exiting the narrows of the slot canyon, I headed up the wash to the point I would climb up and over into the Bowl of Fire. Checking my map, the climb seemed much steeper that the map showed.
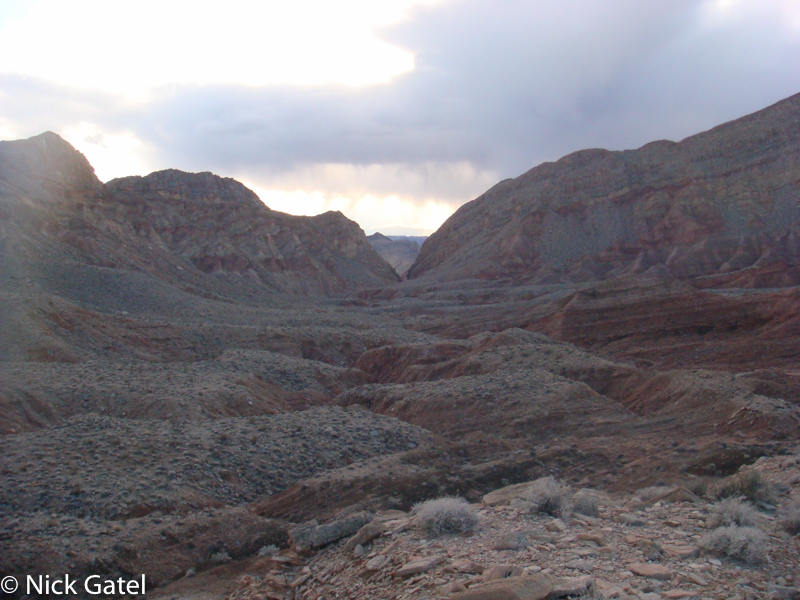
I triple-checked the map and was certain I was at the right place. Slowly working my way up, the route was fairly difficult and took much longer than anticipated. I finally got to the top and looking down into the Bowl of Fire, could not see any feasible way down.
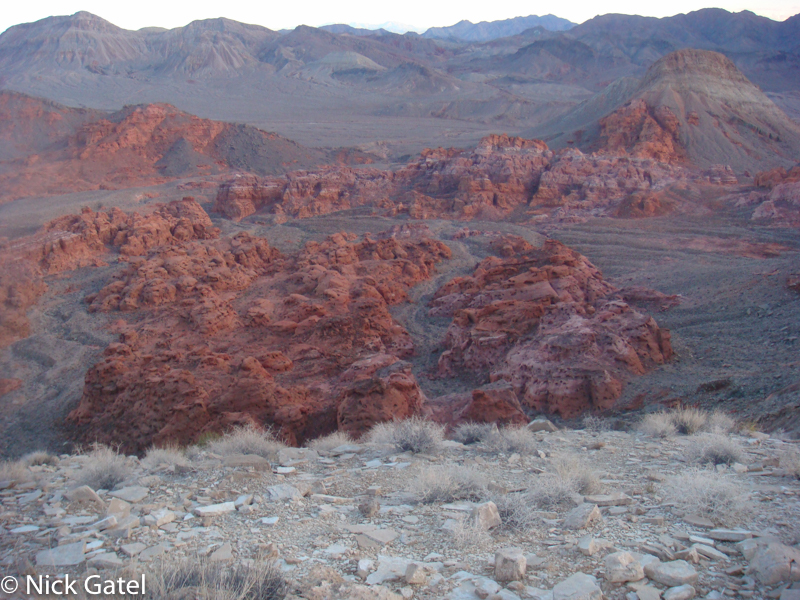
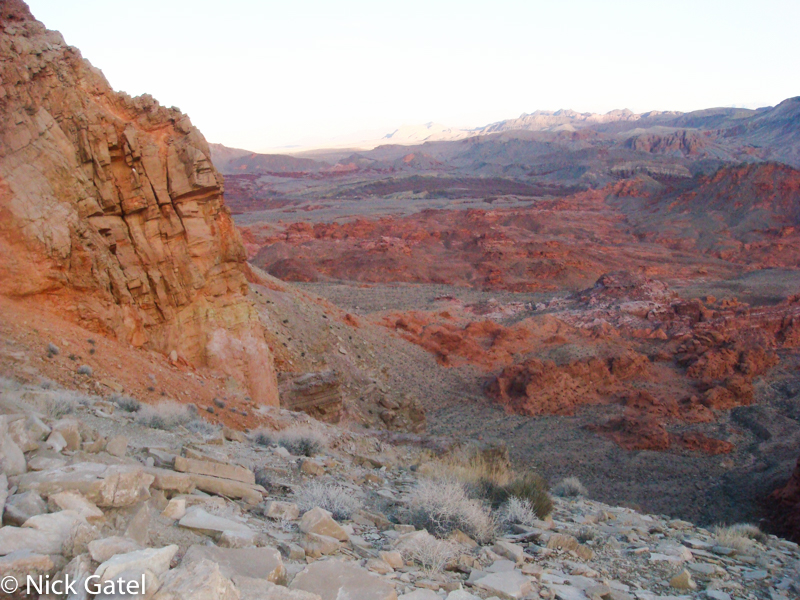
The slopes were much too steep and treacherous to try. I must be lost, I thought. I sat down and consulted my map, and it appeared I was in the right place, but there was no way I was willing to try and get down, espcially since I was hiking solo.
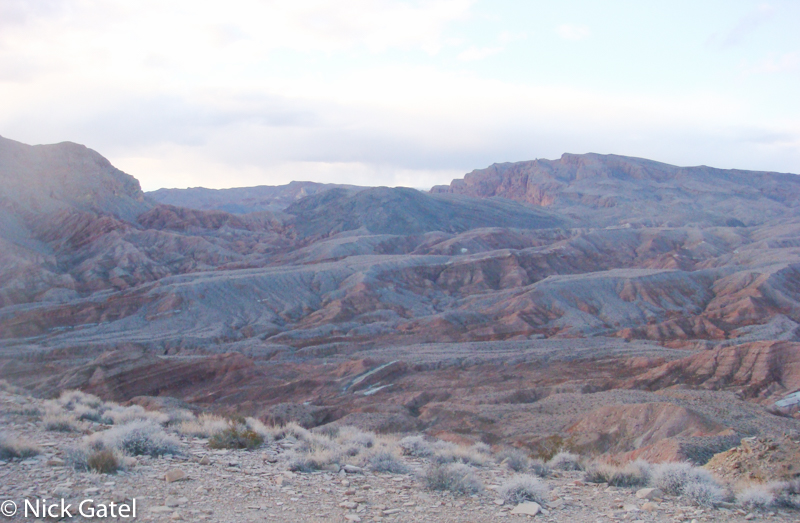
The map was printed by the United States Geological Survey (USGS). The map scale was 1:24,000. I had been using these maps for almost 40 years. The elevation is marked by contour lines that are spaced at 40 foot intervals. The closer the intervals, the steeper the terrain. Everything look correct. I triangulated my position using my compass, and I was in the right spot. Then I figured out the problem.
Seems the map had been created by metric communist wackos. A note at the bottom of the map stated the contours were 20 meter intervals. That means they were more than 65 feet apart; meaning the contour was 63% steeper than a “real” map. Communist Bastards!

It was getting late, it was getting cold, and the breeze was picking up. I decided to make camp on a ledge, prepare dinner, and develop a new route.
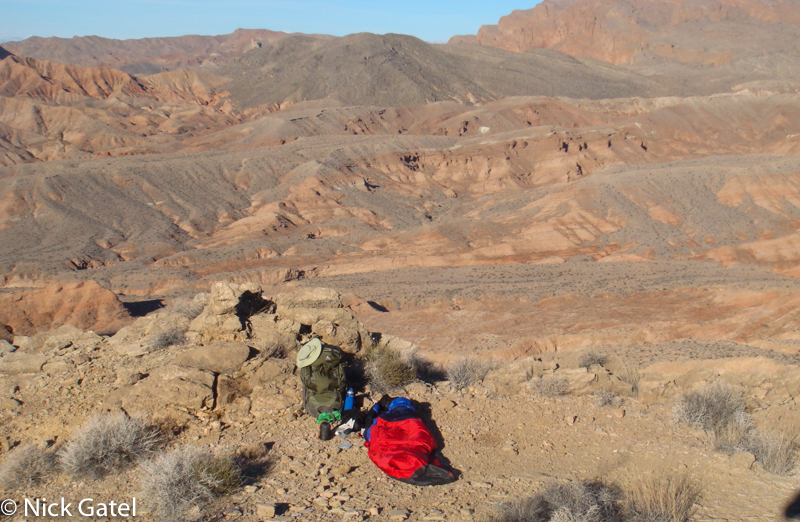
A new route is a cardinal sin. I have left my route with Joyce, and should I get injured or lost it would be difficult for anyone to find me. Oh, well… I never follow rules anyway. I finally decided to continue up the wash in the moring and then circle back to the Bowl of Fire. This would put be a day behind, so I would need to take another route to Lake Mead — needing to get there for water — I would be getting to the lake a day later than planned.
Because I had found standing water in the slot canyon, I knew I would be able to find small pools of water the next day.

The detour was worth the effort. I spent much of the afternoon exploring and got a wonderful night’s sleep among the red rock formations. I have returned to this place many times since 2008.
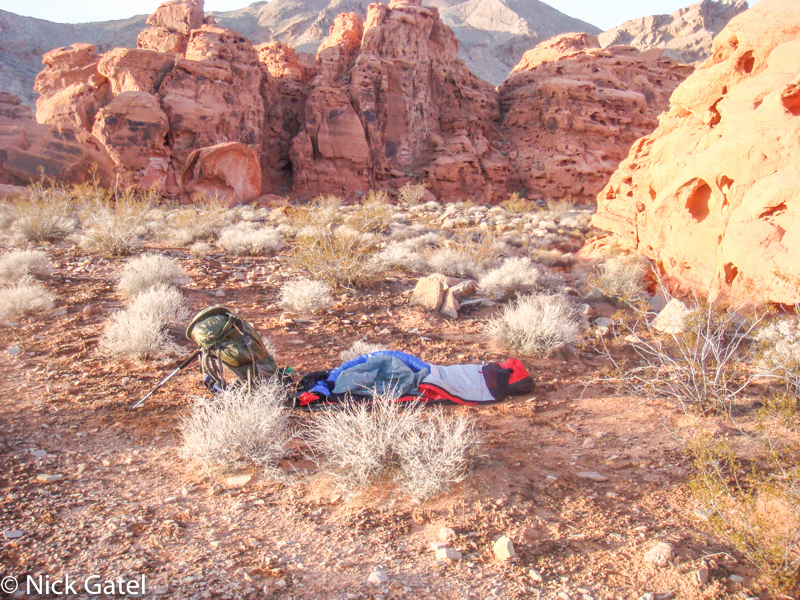
All worked out. The third day I hiked much further than planned and camped on the shore of Lake Mead. On day four I made it to the pick up point on time (actually a little early).
The Rest of the Story
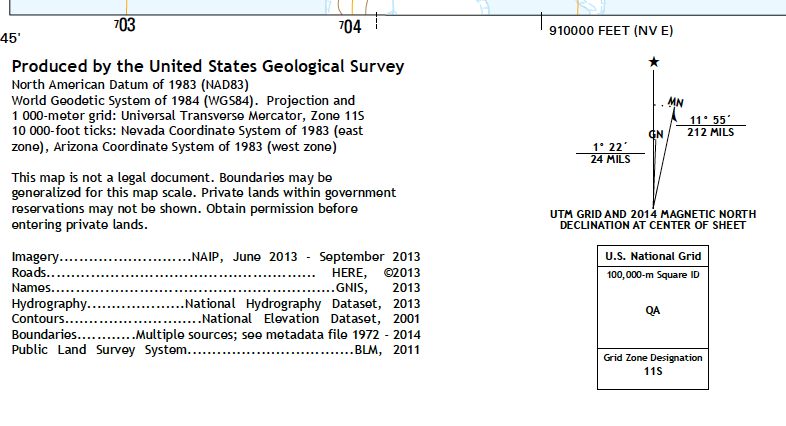
As mentioned, Map 2 was updated in 2014. Here are some changes…

Conclusions
USGS Topographical Maps are awesome! You can download them from the USGS Store for free: click here for the link. You can also purchase paper copies online. Prices vary. The 1983 version of Map 2 sells for $8 and the 2014 version is $20. I find it is cheaper to download and have the maps printed at Kinko’s, Staples, etc. Also, some locations have old fashioned retail map stores. I have purchased many of my maps from Desert Map and Aero Photo in Palm Desert, CA, which is about 30 minutes from our house. They have all sorts of useful stuff besides topographical maps.
Keep in mind that not all USGS Topo Maps are equal, and check some of the things I have pointed out when using a new map, and have fun hiking!