Tag Archives: Home Energy Upgrade

Energy Upgrade Stats: Month 12 (1 year of tracking)

In January I wrote that home solar might be lipstick on a pig, and it makes more sense to make a home energy efficient before even considering solar. I also promised to post monthly updates on our utility bills.

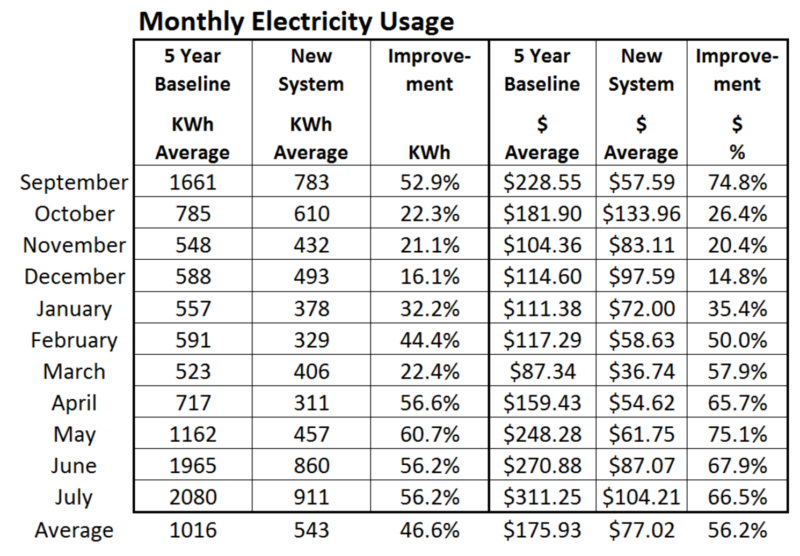
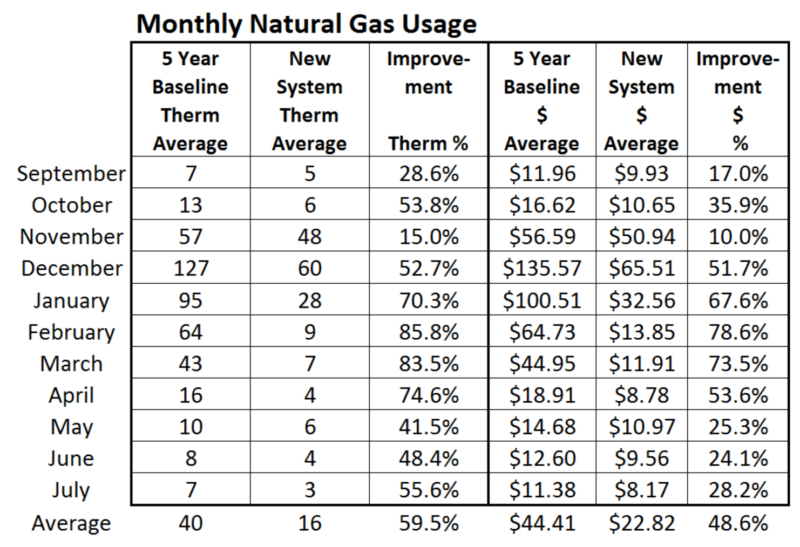
Well, we now have 12 complete months of energy usage under our belts after making our energy upgrade improvements. We’ll take a look at:

  • Our original goals for improvement
  • The results vs. the goals
  • Some potential future savings
  • A great tool for measuring kWh usage of a single device

Continue reading Energy Upgrade Stats: Month 12 (1 year of tracking)

Energy Upgrade Stats: Month 10

In January I wrote that home solar might be lipstick on a pig, and it makes more sense to make a home energy efficient before even considering solar. I also promised to post monthly updates on our utility bills.

I’m going to something a little different this month. June was hot. Hotter than a normal June, so before I post the YTD analysis, I am going to share a graph with our daily electricity use versus the high temperature each day. Keep in mind that weekends are going to be higher than weekdays, because we are home, usually inside, spending time together versus the weekdays when I am outside working and Joyce is at work. Quite a while ago, before our upgrade, Southern California Edison installed a wireless electric meter that sends information to Edison. The great thing about this set-up is Edison can now compile data for the homeowner to help analyst usage, which is where I got the data for the chart.

Bottom line for June is electrical use was down 56.2% against the 5 year average, and natural gas use was down 48.4% and I am thrilled with both!

Continue reading Energy Upgrade Stats: Month 10

Energy Upgrade Stats: Month 9

In January I wrote that home solar might be lipstick on a pig, and it makes more sense to make a home energy efficient before even considering solar. I also promised to post monthly updates on our utility bills.

A little late in posting May’s energy usage, but we were away camping for a couple weeks. Two factors upped this month’s electricity bill. First was above average temperatures at the end of the month.

may temps

The other negative factor was we accidentally left two ceiling fans running 24/7 the last week of the billing period while we were camping.

Good news is found in this Home Energy Report from Southern California Edison.

Screen Shot 2016-06-22 at 8.08.28 AM

Continue reading Energy Upgrade Stats: Month 9

Energy Upgrade Stats: Month 8

In January I wrote that home solar might be lipstick on a pig, and it makes more sense to make a home energy efficient before even considering solar. I also promised to post monthly updates on our utility bills.

One thing I did towards the end of the month was install a new water heater. If you are interested in what I found from my research, you can read the nightmarish details after the charts.

As planned, electricity use is declining versus the 5 year baseline as the as the average temperature increases. Improved insulation and a more efficient air conditioner are using much less energy. For April our electricity use is down 56.6% versus the 5 year April baseline WITHOUT a solar system.

month 8 elec use month 8 gas use

Continue reading Energy Upgrade Stats: Month 8

Energy Upgrade: Stats Thru Month 7

In January I wrote that home solar might be lipstick on a pig, and it makes more sense to make a home energy efficient before even considering solar. I also promised to post monthly updates on our utility bills.

A couple things about last month… first we normally go camping for at least a week during  Easter break, but this year we stayed home and hosted visiting relatives, which increased electricity use. Secondly, we received a $38 “Climate Credit” on our bill, as did every homeowner who is a Southern California Edison customer. This credit is the result of California’s “Cap and Trade” program, which allows companies to continue to pollute by purchasing ’emission credits’ in a fake market created by the State, so they can claim we are a ‘green state.’ Everyone gets the same dollar amount, irrespective how much electricity they use — theoretically encouraging homeowners to invest in energy efficient upgrades; but there is no method to track if this works or even happens. Another Government Boondoggle, as I wrote about in Green Greed.

Here is month 7:

Electricity Usage month 7 Natural Gas Usage month 7

Go to Month 6 Stats

Go to Month 8 Stats